
Today students use the <. >, and = symbols to compare quantities found in the Favorite Day of the Week graph. They will look at the same data in a horizontal format rather than a vertical format, like the graph they created in Lesson 2.

Math4u grade 2 first term
لشراء كتاب ماث فور يو جريد 2 أضغط هنا
ولمشاهدة شرح دروس ماث جريد 2 الترم الاول المنهج الجديد بأسلوب سهل وبسيط
أضغط على الرابط التالى
ولمشاهدة شرح دروس ماث جريد 2 الترم الاول المنهج الجديد بأسلوب سهل وبسيط
أضغط على الرابط التالى
Mathematics Teacher`s Guide primary 2
Math primary 2 first term lesson 3
Calendar Math (15 minutes)
Directions
1.TEACHER DO: Point to the month at the top of the calendar.
TEACHER SAY: We are in the month of (current month). Let’s say all of the months together. I will say them first and you repeat me.
STUDENTS DO: Repeat the months aloud.
Point to the days of the week on the calendar.
Let’s say the days of the week all together. Say them with me as I point.
Point to the days of the week as the students say them aloud.
Say the days of the week.
Today is (day of the week).
Point to the day of the week on the calendar.
Today is the (number) day of (month). We can put it all together to say today’s date. Today is (day) the (date) of (month) (year). Now you say today’s date.
Say the date aloud.
2. Let’s count to see how many days we have been in school.
Use Calling Sticks to select a student to place 1 counting straw in the Ones pocket.
How many straws are in the Ones pocket now? Let’s have ______ (student’s name) count.
Selected student takes the counting straws out of the Ones pocket and counts them aloud.
Thank you, ______ (student’s name). There were 2 straws in the Ones pocket and we added 1 stick today, so now we have 3 straws. We have been in school 3 days.
3. Use Calling Sticks to select another student to circle 3 on the 120 Chart.
Selected student circles 3 on the 120 chart.
Let’s count all of the circled numbers together.
Count aloud to 3 with the teacher.
Learn (40 minutes)
Directions
Note to the Teacher: Be sure to have the >, <, and = symbols written on the board or a poster for students to reference. Review the graph in advance so that you understand the data and have comparison questions prepared.
1. In our last lesson, we made a class bar graph about our favorite days. On the board is a new bar graph that displays the same data. Take out your student book and look at the graph you made in Lesson 2.
Take out student book and turn to page Lesson 2: Apply.
Who notices something different about today’s bar graph compared with yesterday’s? Turn and Talk to your Shoulder Partner. Give me a Thumbs Up when ready to share.
Give students 1 to 2 minutes to talk to partner.
Talk to Shoulder Partner about what they notice. Selected students share their thinking.
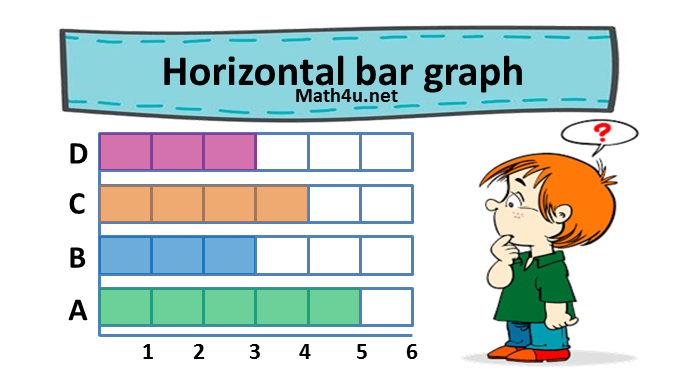
Good. This graph has the same labels and title as yesterday’s graph, but instead of the days of the week being on the horizontal line, they are up and down on the vertical line. The bars are going across the graph instead of up. Is the information the same in both graphs? Think for a moment. Give me a Thumbs Up when you are ready.
Think for a moment. Give a Thumbs Up when ready. Selected students share their thinking.
Yes, the graphs look different, but the information is the same in both. We can make bar graphs going in either direction. What is most important is that we have:
• A horizontal side that is labeled.
• A vertical side that is labeled.
• A title to tell people what the graph shows.
• Numbers to help us read the data.
Hold up one finger as each item is stated.
Now, you say it with me.
Say aloud with the teacher:
• A horizontal side that is labeled.
• A vertical side that is labeled.
• A title to tell people what the graph shows.
• Numbers to help us read the data.
2.This year, we will work with bar graphs that go in either direction, so I wanted you to see our favorite day data both ways. I am going to put up the vertical graph that we made yesterday next to this one. We will compare the data to answer some questions about our favorite days. Does it matter which graph you look at to find the answer? Give me a Thumbs Up if you want to share your thinking.
Think for a moment and then give a Thumbs Up to volunteer. Selected students share their thinking. Students should note that it does not matter which graph they refer to because they show the same data.
Note to the Teacher: In this section, the days Monday and Saturday are used as examples. Be sure to use your class bar graph and choose appropriate days based on your class data when asking students to compare totals.
3. Let’s look at this data. Graphs help us organize information that we can then talk about and compare. When we compare quantities—or amounts—we can use symbols to show which amount is greater, less, or equal. Let’s try this together using this graph. How many students have Monday as their favorite day of the week? (Choose a day with a relatively small number of students.) I will use Calling Sticks to choose someone to answer.
Selected students state how many students have Monday as their favorite day.
How many students have Saturday as their favorite day of the week? (Choose a day with a large number of students.)
Use Calling Sticks to choose a student to answer.
Selected students share their answer.
Good. Monday had _____ students and Saturday had _____ students. We could look at the bars to help us read the graph. We follow the top of the bar to the number along the vertical or horizontal side, depending on which version of the graph we look at, but the number of students is the same. I am going to write both quantities on the board.
Model how to follow the bar horizontally or vertically to determine the quantity, and show that both versions of the graph have a bar with the same quantity. Write the two quantities on the board with space in between them.
Let’s look at these two numbers. There is a math symbol we can use to compare these two numbers. Give me a Thumbs Up if you remember the symbols for less than, greater than, or equal to and want to share your thinking.
Give a Thumbs Up to share their thinking about the symbols for less than, greater than, or equal to.
Display your poster showing the comparison symbols.
The less than symbol, greater than symbol, and the equal symbol help us show comparisons between quantities. Raise your hand if you would like to come up and put in the correct symbol to show how Monday’s number of students compares to Saturday’s number of students.
Raises hand to share. Selected student goes to the board and writes the correct symbol.
Good. Monday had _____ students and that number is less than the ____ students who liked Saturday, so we use the less than symbol.
Point to the less than symbol.
When we see this symbol, we say “ ____ is less than ____”. Say it with me.
Repeat “____ is less than ____.”
4. Now let’s try some other comparisons as we look at this graph. Turn to page
Lesson 3: Apply in your student book. The first question says:
READ ALOUD: Tuesday __________________ Friday
To answer this, we need to look at the graph to see how many students like Tuesday best. Work with your Shoulder Partner and your graph to find out how many people like Tuesday best. Record the number on the line in your book. Then find out how many people like Friday best and record that number on the line. I will give you a few minutes to work together and then call on someone using the Calling Sticks to come up and share how they found the numbers.
Write the question on the board. Give students 2 or 3 minutes to look at the graph and record the number of students for both days at the top of the page. Walk around and offer help as needed.
Work with Shoulder Partner to find number of students from graph and record.
Use Calling Sticks to choose a student to come up and show how they found the number of students. As the student is sharing, model how to follow the bar to find the number of students. It is important that students understand that the bar represents a number of “things.” In this case, each bar represents the number of students who like a given day best.
Selected students share how they found the numbers and record both numbers on the board.
Good. You used the bars to find how many students liked each day. Now that we have recorded the two numbers, which symbol should we use to compare these numbers? Give me a Thumbs Up if you want to come up and write in the symbol on the board between these two numbers.
Give a Thumbs Up to volunteer. Selected students go to the front and write in the symbol. Students “read” the comparison aloud.
If necessary, explain further for students who seem to be struggling to understand which symbol to use.
5. Great. Now that we have compared Tuesday and Friday, you will spend the rest of math class today looking at your graph and doing some more comparisons. First, let’s practice using our arms. Stand up.
Stand.
Model how to create each symbol using your arms. Ask students to copy your movements.
Make the less than, greater than, and equal to symbols using their arms.
That looked great. The comparisons are written in your student book. Work with your Shoulder Partner to find the numbers and then compare them using the signs for less than, greater than, or equal to. Remember, if two days have the same number of students that like them, then they are equal, and we will use the equal symbol.
Work with Shoulder Partner on comparisons in student book for Lesson 3 for the rest of the Learn time.
Walk around the class and observe students using the graph and comparing the numbers. Off er assistance when needed and make note of students who are struggling to interpret the graph or to use the correct symbols.
